VS Code debugging
DCC source debugging is available in Visual Studio Code through the Microsoft
C/C++ extension and dcc-debug-host's GDB/MI interface. A debug build produces
a CP/M .COM program and a matching .DBG metadata file. dcc-debug-host
boots CP/M, runs the program, and presents source, stack, variables, memory,
and Z80 instructions to VS Code.
For the most accurate source-level experience, use the default no-peep debug build. Optimized debug builds are also available for defects that reproduce only after peephole optimization, with the limitations described below.
See Debugger host and I/O adapters for the full-system architecture, target terminal, dynamic I/O adapter, and terminal pipeline.
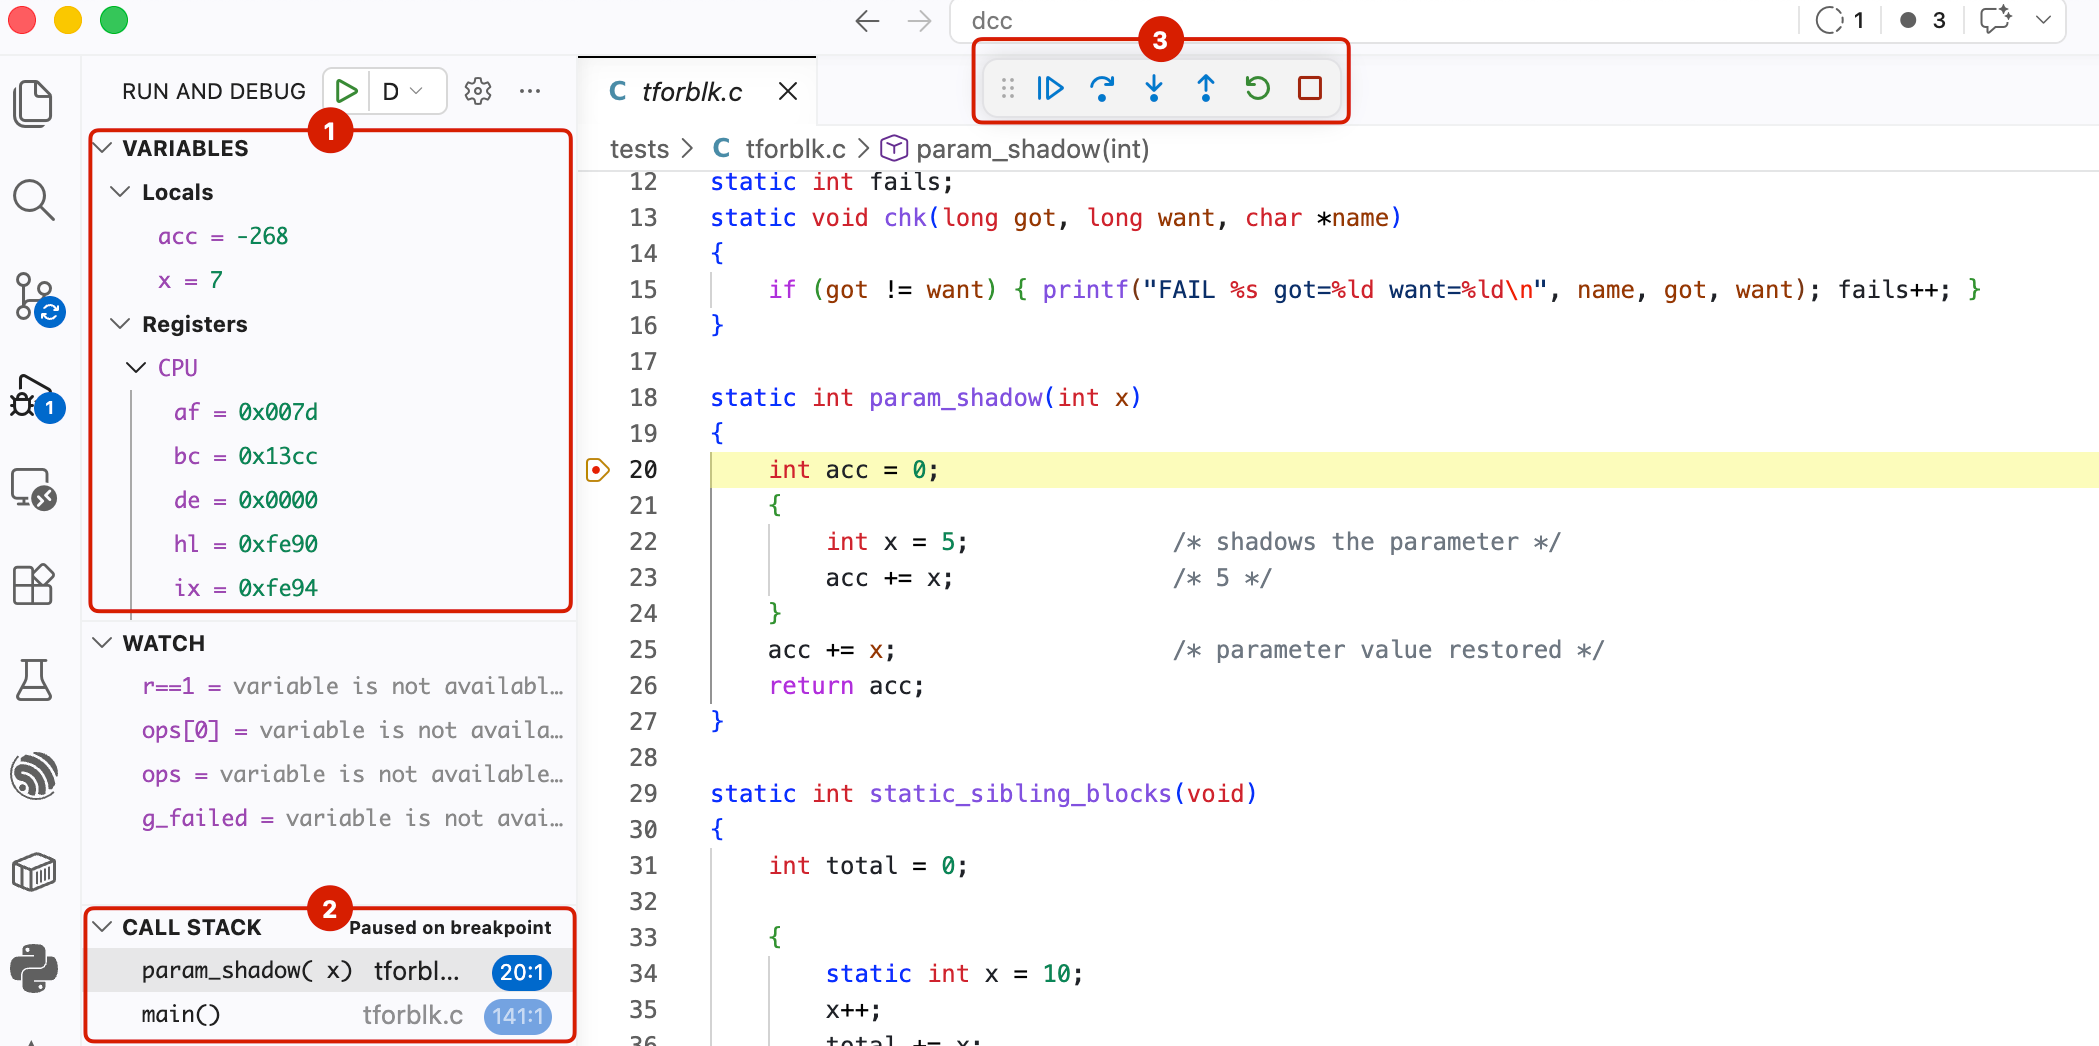
How debugging works
The debugger uses four cooperating pieces:
dccmake -ginvokes DCC with debug metadata enabled for every C source in the program. DCC writes source, function, variable, type, and scope markers into the generated assembly.- Native
m80cassembles each module and records those markers as segment-relative metadata in a per-module.DBGfile. dccmakelinks the program and writes one finalDCCDBG 2file whose addresses match the linked.COMimage.dcc-debug-hostboots CP/M, loads the.COMand adjacent.DBG, exposes them through GDB/MI, and the VS Code C/C++ extension presents that information as source breakpoints, stepping, stack frames, variables, watches, memory, and Z80 disassembly.
The project does not need a hand-written .DBG file. It may need a
dccmake.txt file to describe how the program is built; the debug metadata
itself is generated automatically.
Prerequisites
Before configuring a project:
- Build and configure the DCC toolchain. The normal
scripts/build-dcc.ps1build includesdcc-debug-host. - Install the Microsoft C/C++ extensions for VS Code.
- Make
dccmakeavailable onPATH, or use its absolute path in the build task. - Make sure
dccmakecan finddcc,dccpeep,dccrtlstrip,m80c,DCCRTL.MAC, and the configured linker as described on The toolchain.
Debug metadata requires the native
m80c assembler. Do not set
dcc-use-emulated-m80=true for a debug build.
Source and output names must also satisfy CP/M 8.3 naming rules. In particular,
dcc-output is at most eight characters and has no extension.
Add debugging to a project
A project needs three configuration files in addition to its C sources:
my-project/
├── .vscode/
│   ├── launch.json
│   └── tasks.json
├── dccmake.txt
├── main.c
└── module.c
Build DCC once with scripts/build-dcc.ps1, then set DCC_DIR in the
environment inherited by VS Code to the DCC repository directory. For example,
on macOS or Linux:
export DCC_DIR="$HOME/GitHub/dcc"
code my-project
In PowerShell on Windows:
$env:DCC_DIR = "C:\GitHub\dcc"
code my-project
Add dccmake.txt
This example builds two translation units as build/PROGRAM.COM and writes the
matching metadata as build/PROGRAM.DBG:
dcc-input=main.c,module.c
dcc-output=PROGRAM
dcc-build-dir=build
dcc-stack-bytes=1024
dcc-runtime=${DCC_DIR}/DCCRTL.MAC
dcc-include-directory=${DCC_DIR}
dcc-tool=${DCC_DIR}/dcc
dccpeep-tool=${DCC_DIR}/dccpeep
dccrtlstrip-tool=${DCC_DIR}/dccrtlstrip
m80c-tool=${DCC_DIR}/m80c
l80c-tool=${DCC_DIR}/l80c
Replace the source list, output name, and stack size with the project's actual
values. The output name must fit CP/M's eight-character basename limit. On
Windows, append .exe to the five host-tool paths. These paths make an
external project independent of the shell's tool search path; setting only
the task's dccmake path does not locate the runtime or headers.
Add .vscode/tasks.json
The build task runs dccmake -g from the project root. dccmake reads the
adjacent dccmake.txt and generates both required debug artifacts:
{
  "version": "2.0.0",
  "tasks": [
    {
      "label": "Build DCC program for debugging",
      "type": "shell",
      "command": "${env:DCC_DIR}/dccmake",
      "args": ["-g"],
      "options": {
        "cwd": "${workspaceFolder}"
      },
      "problemMatcher": []
    }
  ]
}
Add .vscode/launch.json
The launch configuration points VS Code at the .COM file and uses
dcc-debug-host as its GDB/MI executable. Keep program synchronized with
dcc-output in dccmake.txt:
{
  "version": "0.2.0",
  "configurations": [
    {
      "name": "DCC CP/M: Debug PROGRAM",
      "type": "cppdbg",
      "request": "launch",
      "preLaunchTask": "Build DCC program for debugging",
      "program": "${workspaceFolder}/build/PROGRAM.COM",
      "cwd": "${workspaceFolder}/build",
      "MIMode": "gdb",
      "miDebuggerPath": "${env:DCC_DIR}/dcc-debug-host",
      "miDebuggerArgs": "--interpreter=mi",
      "windows": {
        "miDebuggerPath": "${env:DCC_DIR}/dcc-debug-host.exe"
      },
      "targetArchitecture": "x86",
      "sourceFileMap": {
        "${workspaceFolder}/build": "${workspaceFolder}"
      },
      "launchCompleteCommand": "exec-continue",
      "externalConsole": false
    }
  ]
}
sourceFileMap maps paths reported relative to the .COM directory back to
the project root. It also handles source subdirectories: a recorded src/foo.c
resolves through build/src/foo.c and maps to src/foo.c in the project.
Select DCC CP/M: Debug PROGRAM in Run and Debug, set a source breakpoint, and press F5.
What happens after F5
- VS Code runs the pre-launch task, and
dccmake -gcreates a matched.COMand.DBGpair. - The C/C++ extension starts
dcc-debug-hostand communicates with it using GDB/MI. No separate GDB installation is used. - The host boots its CP/M 2.2 system, stages the selected program on its disposable B: drive, and launches it at the normal CP/M transient-program address.
- The host translates VS Code breakpoints, stepping, variable requests,
memory access, and disassembly requests through the linked
.DBGmetadata. - Program output appears in the Debug Console. On normal exit, the program returns to CP/M and the debug session reports completion.
The .COM contains the executable Z80 program; the .DBG sidecar is debugger
metadata and is not copied to CP/M hardware. Both files must remain adjacent
and come from the same build.
Use an I/O adapter
An I/O adapter is optional. It supplies machine-specific ports, terminal
translation, or interrupt sources that are not part of generic CP/M. The normal
DCC build publishes an example adapter beside dcc-debug-host. Replace the
launch configuration's miDebuggerArgs and Windows override with:
"miDebuggerArgs": "--interpreter=mi --io-adapter \"${env:DCC_DIR}/libdcc-debug-io-adapter-example.dylib\"",
"linux": {
  "miDebuggerArgs": "--interpreter=mi --io-adapter \"${env:DCC_DIR}/libdcc-debug-io-adapter-example.so\""
},
"windows": {
  "miDebuggerPath": "${env:DCC_DIR}/dcc-debug-host.exe",
  "miDebuggerArgs": "--interpreter=mi --io-adapter \"${env:DCC_DIR}/dcc-debug-io-adapter-example.dll\""
}
The example adapter provides polling timers and a periodic interrupt source;
see the timer and
interrupt programs.
For a custom adapter, substitute its shared-library path and add --env-file
if that adapter consumes project configuration. See
Debugger host and I/O adapters for the adapter contract.
Configure the project build
dccmake.txt is optional for a standalone source file, but recommended for a
real application. Use it whenever the debug build needs information that cannot
be inferred from the active file, including:
- more than one C translation unit;
- an output name different from the source basename;
- a non-default stack size;
- compiler definitions, include directories, or floating-point I/O options;
- explicit runtime or tool paths; or
- other application-specific
dccmakesettings.
dccmake reads dccmake.txt from its current working directory. A typical
project file is:
dcc-input=main.c,module.c
dcc-output=PROGRAM
dcc-build-dir=build
dcc-stack-bytes=1024
dcc-peep=true
dcc-input must list every C translation unit needed by the link. dcc-output
controls the basename of both final artifacts:
build/PROGRAM.COM
build/PROGRAM.DBG
Command-line values override file values. The VS Code task passes -g; the
project file does not need a separate debug setting. Although a normal build
may set dcc-peep=true, dccmake -g skips dccpeep unless
dcc-peep-debug=true is explicitly requested.
For a program whose full no-peep debug image is too large, set:
dcc-debug=lines
This project setting refines the generic -g supplied by the VS Code task. It
uses normal optimized compiler and peephole output while emitting line,
function, type, scope, global, and ranged variable-location metadata. The
resulting .COM is byte-identical to the corresponding release build. Values
that cannot be recovered are shown as <optimized out>; see
Optimized debug builds for the available locations.
Add the build task
For a project with dccmake.txt, create .vscode/tasks.json and run
dccmake from the active source directory so it finds that file:
{
  "version": "2.0.0",
  "tasks": [
    {
      "label": "Build active DCC C file for debugging",
      "type": "shell",
      "command": "dccmake",
      "args": ["-g"],
      "options": {
        "cwd": "${fileDirname}"
      },
      "problemMatcher": []
    }
  ]
}
Replace dccmake with an absolute path if it is not on PATH. For a standalone
file with no dccmake.txt, pass the active source and output explicitly:
"args": [
  "-g",
  "dcc-input=${file}",
  "dcc-output=${fileBasenameNoExtension}",
  "dcc-build-dir=build"
]
The active editor file is not necessarily the program's main module. When a
dccmake.txt file exists, its dcc-input list remains authoritative.
Keep the COM and DBG files paired
dcc-debug-host derives the metadata filename from the program filename. If
VS Code loads PROGRAM.COM, the host looks for PROGRAM.DBG in the same
directory. The files must:
- have identical basenames;
- be adjacent;
- come from the same debug build; and
- not be mixed with stale output from an earlier link.
The launch configuration may load the pair directly from the build directory.
If a shared active-file launch configuration instead expects the source
basename, copy or rename both files. For example, if CHATC11.C has
dcc-output=CHAT:
cp build/CHAT.COM CHATC11.COM
cp build/CHAT.DBG CHATC11.DBG
Copying only the .COM, or assuming that dcc-output always equals the active
source basename, causes the pre-launch task or metadata load to fail.
For the active-file launch configuration below, add a copy task and a compound
pre-launch task. This macOS/Linux example assumes dcc-output=PROGRAM; use
PowerShell Copy-Item commands for the equivalent Windows task:
{
  "label": "Copy DCC debug outputs beside source",
  "type": "shell",
  "command": "cp -f \"${fileDirname}/build/PROGRAM.COM\" \"${fileDirname}/${fileBasenameNoExtension}.COM\" && cp -f \"${fileDirname}/build/PROGRAM.DBG\" \"${fileDirname}/${fileBasenameNoExtension}.DBG\"",
  "options": {
    "cwd": "${fileDirname}"
  },
  "problemMatcher": []
},
{
  "label": "Build and copy DCC program for debugging",
  "dependsOrder": "sequence",
  "dependsOn": [
    "Build active DCC C file for debugging",
    "Copy DCC debug outputs beside source"
  ],
  "problemMatcher": []
}
Replace PROGRAM with the dcc-output value. In a workspace containing many
applications, the copy task may read dcc-output from each directory's
dccmake.txt instead of hard-coding it.
Build the debugger host and add it to the compound pre-launch task:
{
  "label": "Build DCC debugger host",
  "type": "shell",
  "command": "pwsh ./scripts/build-dcc.ps1",
  "options": {
    "cwd": "${workspaceFolder}"
  },
  "problemMatcher": ["$gcc"]
},
{
  "label": "Prepare active DCC program for debugging",
  "dependsOrder": "sequence",
  "dependsOn": [
    "Build and copy DCC program for debugging",
    "Build DCC debugger host"
  ],
  "problemMatcher": []
}
Add the launch configuration
Create .vscode/launch.json with the following configuration. On Windows, use
${workspaceFolder}/dcc-debug-host.exe for miDebuggerPath.
{
  "version": "0.2.0",
  "configurations": [
    {
      "name": "DCC CP/M: Debug active C file",
      "type": "cppdbg",
      "request": "launch",
      "preLaunchTask": "Prepare active DCC program for debugging",
      "program": "${fileDirname}/${fileBasenameNoExtension}.COM",
      "cwd": "${fileDirname}",
      "MIMode": "gdb",
      "miDebuggerPath": "${workspaceFolder}/dcc-debug-host",
      "miDebuggerArgs": "--interpreter=mi",
      "targetArchitecture": "x86",
      "launchCompleteCommand": "exec-continue",
      "externalConsole": false
    }
  ]
}
This example assumes the build task copies both final artifacts beside the
active source under the active source basename, as described above. To launch
directly from the build directory instead, replace both program paths with
${fileDirname}/build/PROGRAM.COM, where PROGRAM is the uppercase
dcc-output value, and map relative source paths from the build directory back
to the source directory with sourceFileMap.
targetArchitecture satisfies the C/C++ debug adapter's launch schema;
dcc-debug-host still executes Z80 code. exec-continue resumes from the
initial CP/M entry stop after VS Code has installed source breakpoints.
Adjust sourceFileMap when metadata contains source paths that differ from the
workspace layout. Add one entry for each source root that needs remapping, or
remove the property when the recorded paths already resolve correctly.
Required debug metadata
The final linked sidecar starts with DCCDBG 2. The supported record classes
are:
| Record | Purpose |
|---|---|
line |
Maps an executable C source line to a linked address. Required for source breakpoints and stepping. |
function-begin, function-end |
Defines function ranges and source names for stack frames, function breakpoints, and stepping. |
variable, variable-end |
Describes parameters and locals, including type, storage, frame offset, array/VLA shape, and lexical lifetime. |
location |
Selects an optimized variable's frame, register, constant, or optimized-out location at a linked address. |
global |
Describes linked global storage and types. |
struct, field |
Describes structures, unions, arrays, and bit-fields used by locals, globals, and watches. |
symbol |
Supplies linked assembly symbols used by disassembly and symbol lookup. |
Users do not write these records. Missing or inconsistent records indicate a toolchain/build mismatch or a compiler/assembler defect. A minimal line-only file can support breakpoints, but variables, stack frames, structures, and watches require their corresponding records.
Relative source paths are allowed. dcc-debug-host reports an absolute GDB/MI
fullname; on Windows and macOS it also matches source filename case according
to normal host filesystem behavior. Use sourceFileMap when a relative path
is resolved from the build directory but the source lives in its parent or
another source root.
Start a debugging session
- Open the C source file to build.
- Set breakpoints in the editor gutter.
- Open Run and Debug and select DCC CP/M: Debug active C file.
- Press F5. VS Code runs the build task, launches
dcc-debug-host, and stops at the first breakpoint. - Use Step Over, Step Into, Step Out, or Continue as with a native program.
Provide data files
The debugger starts with a disposable, memory-backed B: drive. Place data files
in fixtures/ beside the selected .COM, for example
build/fixtures/DATA.DAT for build/PROGRAM.COM. Every non-hidden regular
file is staged before boot; subdirectories are ignored and filenames must be
unique CP/M 8.3 names. The host does not expose the working directory as a live
filesystem.
Add --fixture FILE to miDebuggerArgs for an explicit binary input, or
--text-fixture FILE to convert host LF text to CRLF and append Ctrl-Z.
These are debugger inputs, independent of the regression runner's
tests/_test_overrides.json.
Writes are discarded by default. A generator can use --save-fixtures DIR to
publish final B: contents after normal target exit, excluding the launched
.COM. This replaces the destination directory, so use a dedicated output
directory. Abort, debugger quit, CPU halt, or staging failure leaves an existing
destination unchanged. Saved files retain CP/M 128-byte record padding.
Provide interactive CP/M input
The VS Code Debug Console normally evaluates expressions and debugger commands;
plain text typed there is not target stdin. dcc-debug-host provides an
explicit line-input command for interactive CP/M applications.
When the application requests keyboard input through a blocking BDOS read or a
BDOS 6 polling loop, dcc-debug-host reports a debugger stop. At that stop:
- Select a frame in the Call Stack if VS Code has not selected one.
- Enter this in the Debug Console:
-exec input 10*3
dcc-debug-host queues the text plus a CP/M Return character, resumes the
pending input request, and sends the application's echo and output back to the
Debug Console. No separate Continue is required. For example, CALC receives
10*3, runs until the next breakpoint or input request, and prints
Result: 30. Use -exec input with no following text to submit a blank line.
The command is line-oriented. It does not currently encode individual control keys or terminal escape sequences. Input can also be queued at an ordinary breakpoint before the application reaches its next keyboard read; the command resumes execution immediately.
Troubleshooting
| Symptom | Check |
|---|---|
| The pre-launch task exits with code 1 | Open the task output and find the first failed stage. Confirm that dccmake.txt is in the task's working directory and that dcc-input lists every module. |
| The build succeeds but the copy task fails | Compare dcc-output with the active source basename. Copy build/<dcc-output>.COM and .DBG, not files guessed from the source name. |
| A breakpoint is unverified or reports no executable location | Confirm that the .COM and .DBG are from the same build, the source path matches the metadata, and the source line generates code. Plain declarations without initialization have no executable address. |
VS Code reports SourceRequest not supported |
Rebuild dcc-debug-host from the current DCC source, or configure sourceFileMap for the recorded source root. |
| Typing application text reports that the process is running | Wait for dcc-debug-host's automatic input stop, then use -exec input <text> rather than entering plain text as a debugger expression. Select a call-stack frame if VS Code requests one. |
| A breakpoint or step moves to a nearby line | The requested line may generate no instruction. For an optimized debug build, peephole transformations may also move or remove source markers. Rebuild with plain dccmake -g. |
| Execution runs past a valid breakpoint | Check for a stale or mismatched .DBG, omitted translation units, or a final metadata file whose linked addresses do not match the .COM. |
When diagnosing a copied active-file pair, compare timestamps and sizes for both the build-directory pair and copied pair. Rebuild and copy both files together before restarting the debug session.
Use the disassembly view
While the program is stopped, open the Z80 disassembly in either of these ways:
- open the Command Palette and run Debug: Open Disassembly View; or
- right-click the selected frame in Call Stack and choose Open Disassembly View.
The view opens around the current program counter and shows each instruction's address, machine-code bytes, and decoded Z80 assembly. The current instruction is highlighted. When debug metadata provides a source location, the view also associates the instruction with its C source line.
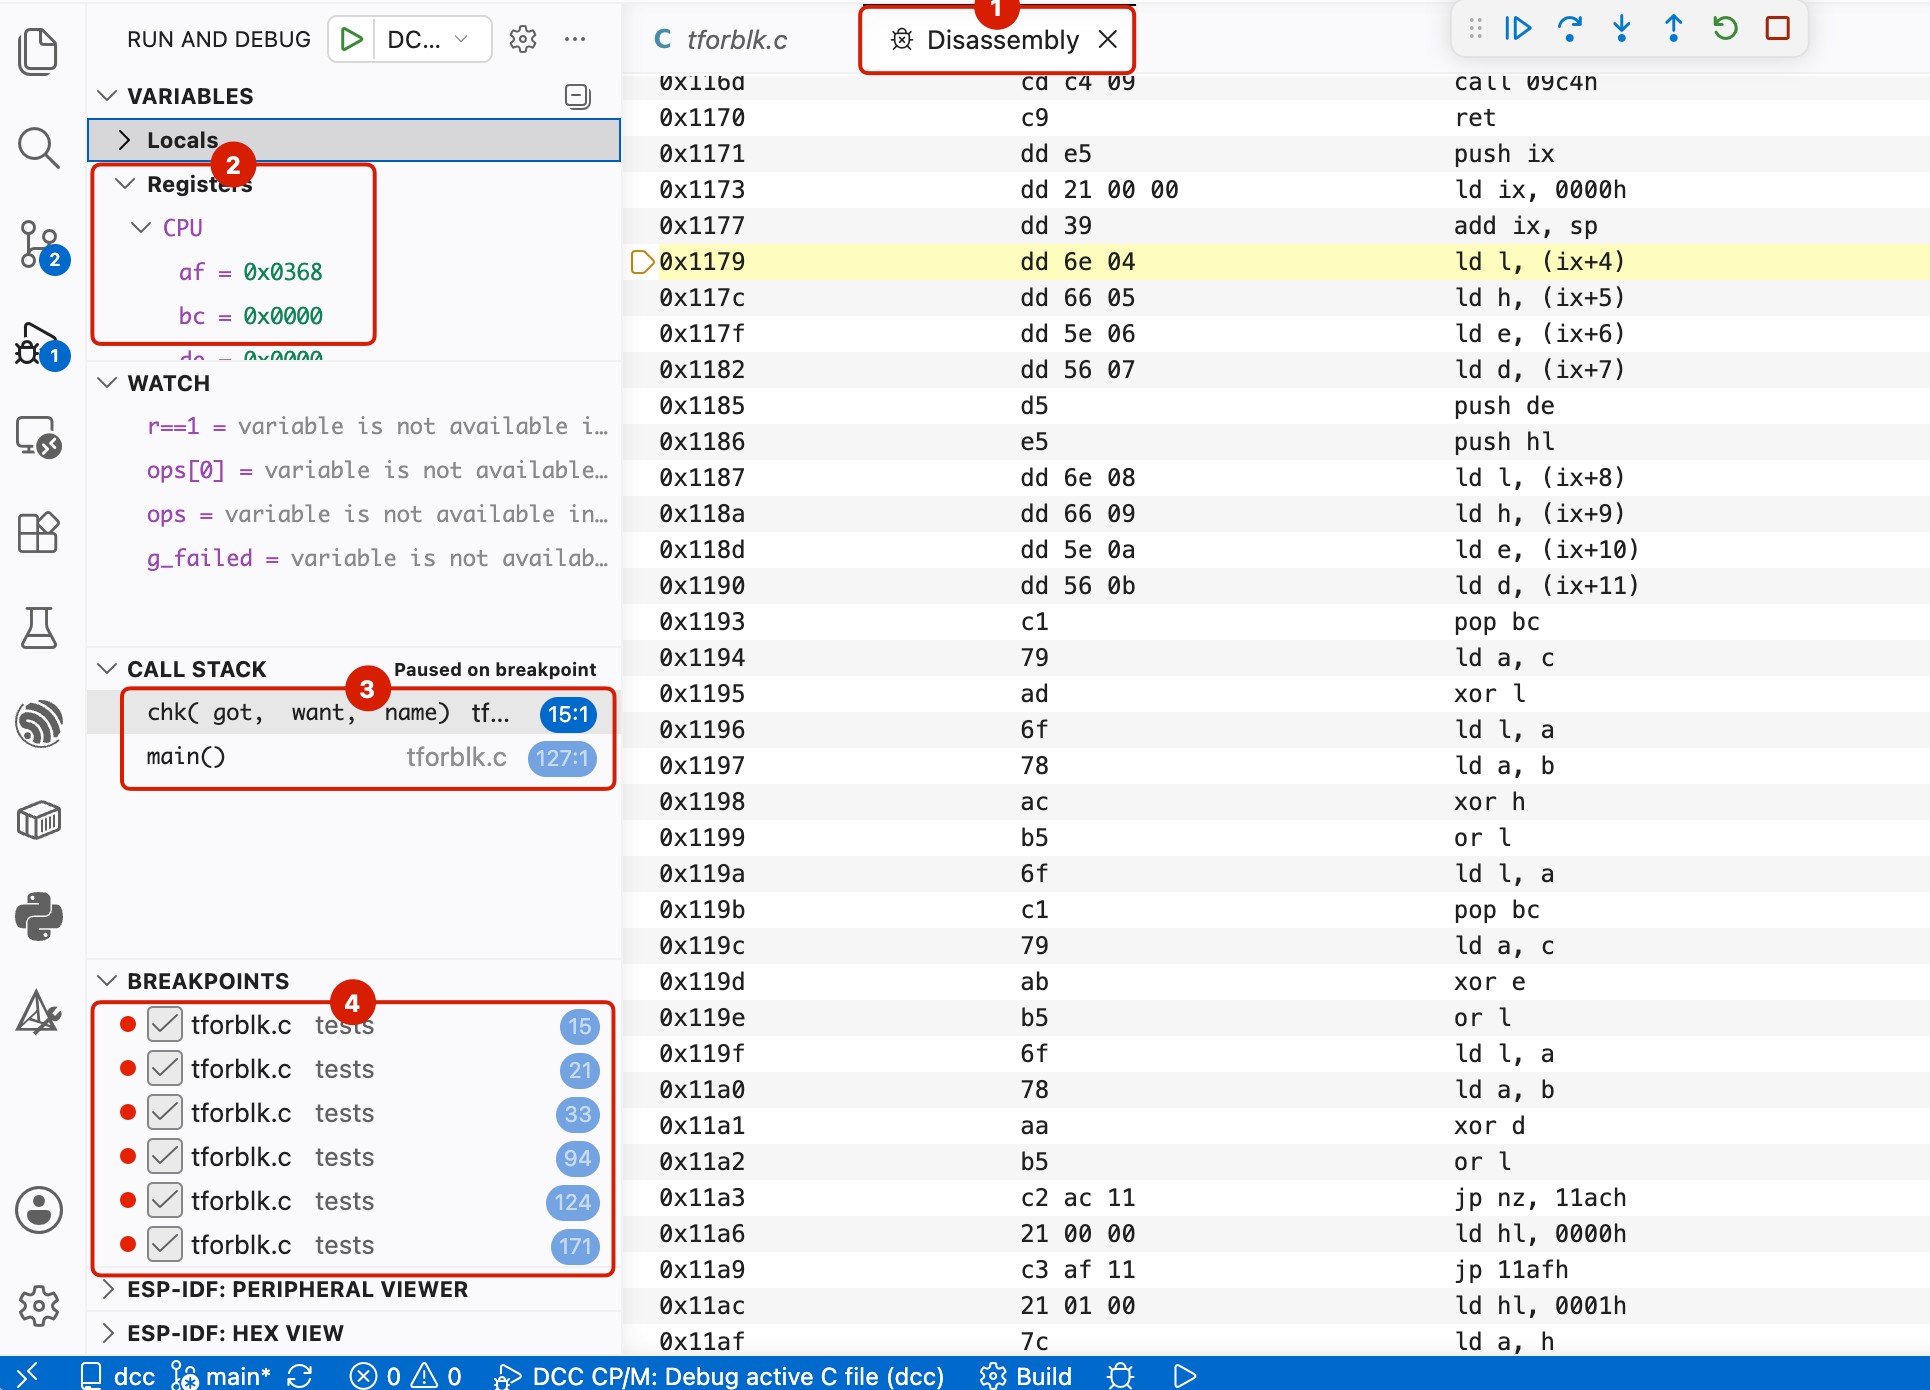
To step through assembly code one instruction at a time:
- Click inside the Disassembly View so it is the active editor.
- Use Step Over (F10) to execute the highlighted instruction and stop
at the next instruction in the current call frame. A
callis executed without entering the called function. - Use Step Into (F11) when the highlighted instruction is a
calland you want to stop at the first instruction in the called function. For other instructions it advances by one instruction. - Use Step Out (Shift+F11) to run until the current function returns, or Continue (F5) to run to the next breakpoint.
After a jump, call, or return, use Debug: Open Disassembly View again if the current instruction has moved outside the visible range. The view recenters on the current program counter. Select a source frame in Call Stack or open the corresponding C file to move back to source-level debugging; both views remain synchronized with the same stopped program.
Instruction stepping is especially useful for:
- checking the exact branch taken by a condition;
- following register and stack changes around calls and returns;
- correlating source expressions with generated Z80 instructions; and
- debugging a
dcc-peep-debug=truebuild when optimized instructions no longer align exactly with source-line markers.
The Disassembly View reflects the linked .COM image that dcc-debug-host is
executing, so addresses and instruction bytes are authoritative for both
no-peep and peep debug builds.
Debugger coverage
The DCC metadata and dcc-debug-host GDB/MI implementation support the main
VS Code C/C++ debugging workflows:
- source breakpoints, temporary breakpoints, conditions, ignore counts, and repeated breakpoint hits;
- source-level Step Into, Step Over, Step Out, Continue, and pause;
- instruction-level stepping and Z80 disassembly with instruction bytes;
- call stacks, recursive frames, frame selection, function names, source files, and source lines;
- function parameters, local variables, globals, lexical scopes, and shadowed names;
- scalar integer types,
_Bool, pointers, function pointers, arrays, variable-length arrays, structures, unions, and bit-fields; - watch expressions including integer arithmetic, comparisons, casts, dereference, address-of, array subscripts, and structure member access;
- memory reads and writes, variable assignment, and register values;
- linked programs built from multiple C source modules; and
- normal program output in the VS Code Debug Console.
The expression evaluator implements a practical target-C subset rather than a complete C compiler. In particular, floating-point expression evaluation and function calls from the Watch or Debug Console are not supported. The target is single-threaded CP/M, so thread-oriented VS Code controls do not represent multiple application threads.
No-peep debug builds
No-peep is the default and recommended mode for source debugging. dccmake -g
keeps every ;@dcc-line marker where DCC emitted it, and
m80c records those
locations in the .DBG file before linking relocates them to final addresses.
In this mode, source breakpoints and source stepping have strong coverage across
ordinary declarations and expressions, calls and returns, nested blocks,
if/else, loops, break, continue, goto, and switch. Closing braces
are represented for blocks that fall through, which makes skipped branches and
loop transitions easier to follow. A source line can still contain several
machine instructions, so instruction stepping remains useful when inspecting
the exact Z80 execution sequence.
Use this mode unless the behavior being investigated occurs only in an optimized binary.
Optimized debug builds
Use dcc-debug=lines in dccmake.txt when the program must retain its normal
optimized size or behavior:
dcc-debug=lines
DCC emits line, function, type, scope, and ranged variable-location events
without selecting conservative debug codegen. dccpeep carries those records separately from mutable assembly,
moves records from deleted instructions to the next executable address, and
re-emits them for m80c. Optimized emitters with instruction provenance retain
statement-level mappings. Specialized kernels without such provenance expose
their function-entry location rather than inventing inaccurate statement
addresses.
This mode supports source breakpoints, source stepping, function names, stack
frames, locals, arguments, globals, structures, fields, registers, memory, and
disassembly. Locations can be frame slots, Z80 register pairs, four-byte
register pairs, constants, or explicitly optimized out. Top-frame register
scalars are editable. Dead values and caller-frame register values that were
not saved are shown as <optimized out> rather than guessed.
Full-debug peephole builds
To debug a problem that appears only after peephole optimization, add
dcc-peep-debug=true to the task arguments:
"args": [
  "-g",
  "${file}",
  "dcc-output=DCCDEBUG",
  "dcc-peep-debug=true"
]
This is an explicit opt-in for conservative full-debug compiler output.
dccpeep preserves metadata and remaps records from deleted instructions, but
the compiler still uses its larger debug-oriented code generation. Use
dcc-debug=lines when the executable must match release code or size.
Typical minor source-level effects include a breakpoint moving to a neighboring executable line, a source line being skipped, or an extra/repeated source step around optimized control flow. Variables, call stacks, memory, registers, and the generated program remain useful, but source-line attribution is less exact.
For an optimized build, treat the Disassembly View and instruction stepping as
authoritative: they always show the instructions dcc-debug-host is actually
executing. Set an initial source breakpoint near the area of interest, then
switch to instruction stepping when source movement no longer matches the
optimized control flow.
To return to no-peep full source debugging, remove dcc-peep-debug=true and
start a new session. Setting only dcc-peep=true does not enable peephole
optimization for a full -g build.